|
Field Strength Indicator |
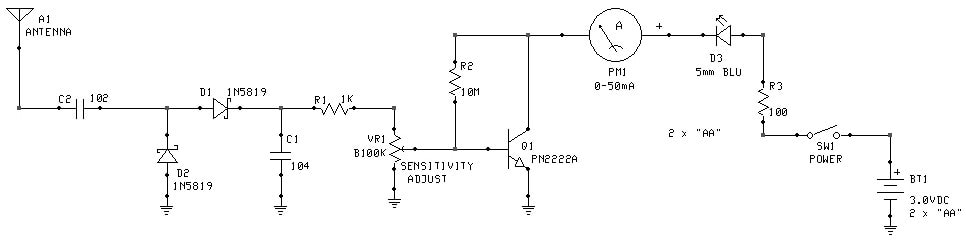
Figure 1 : Schematic Diagram (Click to enlarge)
A Handy Tool For The Shack
By Chris Prioli. AD2CS
We all, as licensed amateur radio operators, have been taught about the evils of stray RF in and around our shacks. We also go to great lengths to measure the forward and reflected power levels as related to our radio and antenna/feedline pairings. But… how many of us have a quick go/no-go indicator of radiated RF in the shack environment? I would venture a guess that not many of us do, but that can change very quickly and for a minimal cash outlay.
Not very long ago, I hit upon the idea of building just such a tool - an inexpensive relative RF field strength indicator. I culled the internet for design ideas and I found several that would do what I wanted, but always with just that little bit of modification. I finally hit upon the design that I would use, the schematic for which is shown in Figure 1. My favored design included two visual indicators, both of which would give an indication of field strength. One of these indicators, however, is rather ambiguous and leaves much open to guesswork - the LED. The other indicator is a 0-50mA analog meter with a custom dial face. The intent of this device is to give a relative indication of RF signal strength, not to specifically quantify that RF level.
After drawing up my schematic and designing a custom PCB for the unit, I stumbled upon a ready-made product in kit form that used a virtually identical circuit. By the time I factored in PCB manufacturing and shipping costs, it turned out to be cheaper to start with this kit as my working unit, and to simply build a suitable enclosure around it. Ultimately, I settled on using the off-the-shelf kit simply as a matter of economics. However, if anyone would rather build this unit from “scratch”, I can provide the schematic, PCB design, and Gerber files for the PCB, though many will opt for the Proto-Board route on something this simple. The parts list will reflect both build plans - so take your pick!
The design is simple enough that it can be built on a proto-board rather than having a PCB made. It consists of a couple of capacitors, three resistors, two Schottky diodes, an NPN general-purpose transistor, and an LED. Externally, we have a telescoping aerial, a panel meter, a power switch, and a 100K? linear taper potentiometer. Power is supplied by a CR2032 coin cell, which is mounted to the PCB in the kit that I used. My original design called for two “AA” cells in series in a two-cell battery holder. If you build from scratch, the remote battery holder is easier to work with, there is plenty of space in the enclosure for it, and the PCB design has two wire connect points for connection of the battery wires. Of course, with a proto-board the holes are already there - just pick a couple and use them!
The circuit is very basic. The incoming RF produces a DC flow at the diodes. The transistor controls the current through the meter and the LED, which are in series with each other, as well as with a current-limiting series resistance. Because the same current flows through the meter and the LED, the LED intensity will track the meter needle movement. The potentiometer is used to control circuit sensitivity.
The aerial base is attached to the PCB (or proto-board) and its body must be insulated from contact with the enclosure if the enclosure is metallic, as is mine. I chose the two-piece aluminum Hammond 1411-LU, which is readily available from suppliers like Mouser Electronics or Digikey Electronics. The parts list will provide suppliers for all unit parts and components.
I laid out all enclosure drillings on a full-size template, thus ensuring that everything would fit where I wanted to place the individual items - the LED, the meter, and the power switch all on the enclosure cover. On the enclosure front, I laid out a single centered hole location for the sensitivity potentiometer. On the enclosure floor, I laid out a single hole location for mounting the PCB, and then transferred the aerial location to the top cover. This is best done by mounting the bare PCB into place on the enclosure floor, and then measuring the distances from the aerial hole in the PCB to the rear face and to the right-side edge of the enclosure lower half. Use these measurements to locate the aerial hole center on the enclosure upper half. Accuracy should be within 1/16” in each direction.
When I assembled the PCB, I made some changes from the intended configuration to aid in my plan to enclose the PCB. Specifically, I replaced the 2-pin jumper used as the power on control with a 2-pin 0.100” KK-series 0° ramp-lock header. I installed another of those headers at the LED installation location, and I installed a 3-pin version at the potentiometer install location. These headers allowed me to connect the meter and LED to the PCB via one plug, the power switch to the PCB via another plug, and the sensitivity pot via a third plug. All of this was to make it easier to access the PCB for battery change purposes. The ramp-lock plug bodies prevent reversal of the plugs on their headers, but care must be taken to avoid accidental crossing of the LED/meter and power switch leads. Figure 2 shows the assembled PCB prior to installation.
The PCB is grounded to the enclosure via its single mounting point, which is accomplished via a 4-40 x 3/8” machine screw/nut combination and a 1/8” long nylon spacer. The area of the enclosure floor under the PCB was covered with two layers of electrician’s friction tape to prevent inadvertent shorts that might occur from any downward pressure on the aerial, because of the fact that the PCB is mounted by a single screw. Figure 3 shows the prepared lower enclosure half, while in Figure 4 we see the PCB installed into the enclosure bottom half.
The enclosure labeling was accomplished via the use of waterslide decals, a single large one each for the top and bottom surfaces, and a single control legend for the sensitivity control on the front surface. All drilled holes to be made (including a 3/8” diameter hole at the center of the meter location) were drilled before the decals were applied. The large meter cutout hole was made with a nibbler tool after the decal had cured in place. The waterslide decals were produced in CorelDraw!®, and were printed on waterslide decal laser stock in my laser printer, all on a single letter-size sheet. The decals were cut out of the sheet and applied to the enclosure surfaces, and were then allowed to cure overnight for complete drying.
The meter face is customized to reflect a scale of zero to five, with half-unit ticks also being marked. These meter marking units are arbitrary and have no meaning other than to indicate the relative strength of an encountered RF field. Because of the near linearity of the circuit, a field reading 5 on the meter is roughly twice as strong as one reading 2-1/2. The actual values involved are in milliamps, with a reading of 2-1/2 equating to a current of 25mA through both the meter and the LED. The custom meter face was made by first removing the meter crystal and the meter faceplate from the meter. The faceplate was then scanned into CorelDraw!® and used as a drawing template for a new face. I drew a large circle to align with the meter arc, and added diametric lines rotated to the various angles necessary to make the tick marks. All were then weld-trimmed to the desired lengths and the line weights were increased to approximate the original scale appearance. The faceplate test was added, and then the faceplate outline was drawn. After printing on label sheet stock, the new face was self-adhered to the back of the original faceplate, which was then re-installed on the meter. Installation of the crystal completed the job.
The wire leads to the sensitivity control are sequenced in order just as if the control was installed in the PCB. This is important to maintain proper directionality of the control in operation. The power switch is a miniature SPST toggle switch. The leads from the switch are not position-sensitive and may be connected in either orientation. The wiring of the LED and meter is polarity-sensitive. The anode lead of the LED is connected to the LED anode pin position on the PCB. The LED cathode lead is then connected to the meter positive post, with the meter negative post being connected to the LED cathode pin position on the PCB.
The enclosure is comprised of two interlocking squared-off open “U” structures, one of which forms the top and two sides while the other forms the bottom and front and rear panels. Figure 5 shows the inside of the assembled upper half of the enclosure. Note that the hole through which the aerial will pass is insulated with a neoprene grommet. The grommet serves two purposes. Obviously, it insulates the aerial from the cover, but secondly, it provides lateral support for the aerial, which is otherwise secured only by the nut on its lower end. This view also lets us see that the meter and the LED are wired in series, observing the correct polarity of both devices.
In Figure 6 we see the upper half of the enclosure with its electrical leads connected to the PCB. The final assembly involves sliding the upper half down over the lower half, while ensuring that the wire leads stay inside the enclosure and the aerial projects through its grommet.
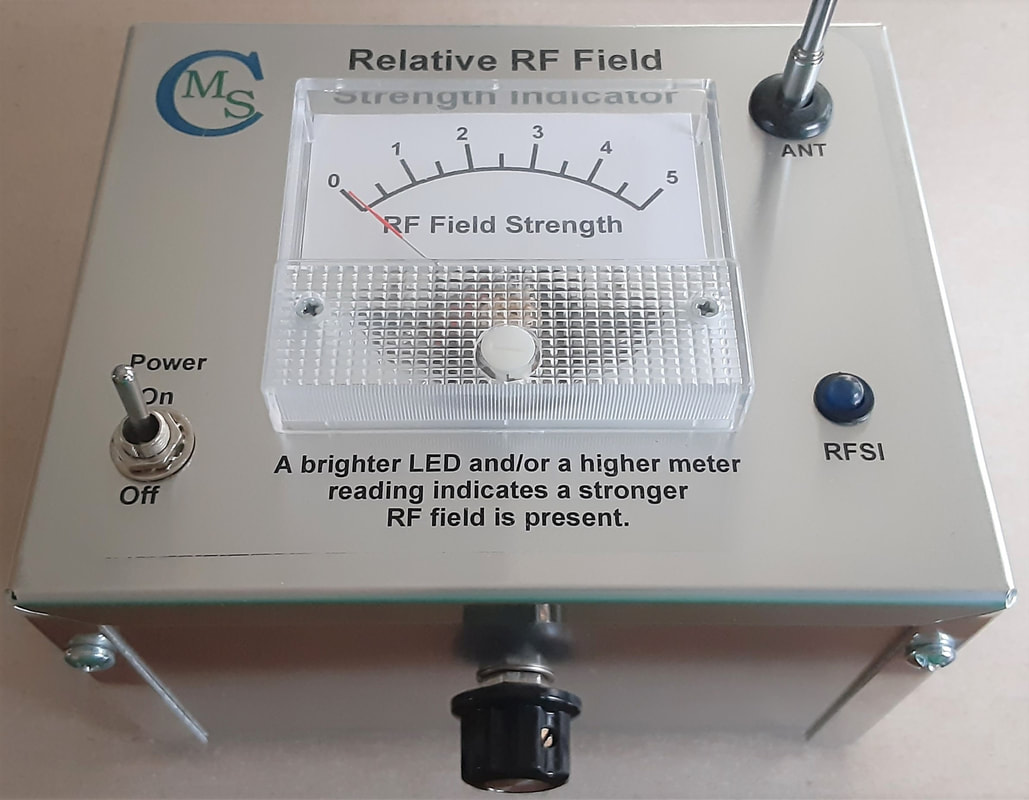
Figures 7, 8, and 9 are external views of the completed unit. Figure 7 depicts the top cover and meter face. Figure 8 shows the bottom surface and its informative label and rubber feet, and Figure 9 shows the sensitivity control on the front panel.
To use the Relative RF Field Strength Indicator, simply extend the aerial to its full length and flip the power switch to its “ON” position. In the presence of an RF field, the LED will illuminate and the meter needle will deflect to the right. The stronger the RF field, the brighter the LED will be and the more the meter needle will deflect. A weak RF field will require clockwise adjustment of the sensitivity control to light up the LED and activate the meter.
With a little bit of practice, the meter can be used to identify those areas in the shack where RF hot spots exist, and for those hams who are into QRP rigs, it works well for reading output power and delineating radiation patterns. Whatever your use, it is a handy little tool to have around the shack.
By Chris Prioli. AD2CS
We all, as licensed amateur radio operators, have been taught about the evils of stray RF in and around our shacks. We also go to great lengths to measure the forward and reflected power levels as related to our radio and antenna/feedline pairings. But… how many of us have a quick go/no-go indicator of radiated RF in the shack environment? I would venture a guess that not many of us do, but that can change very quickly and for a minimal cash outlay.
Not very long ago, I hit upon the idea of building just such a tool - an inexpensive relative RF field strength indicator. I culled the internet for design ideas and I found several that would do what I wanted, but always with just that little bit of modification. I finally hit upon the design that I would use, the schematic for which is shown in Figure 1. My favored design included two visual indicators, both of which would give an indication of field strength. One of these indicators, however, is rather ambiguous and leaves much open to guesswork - the LED. The other indicator is a 0-50mA analog meter with a custom dial face. The intent of this device is to give a relative indication of RF signal strength, not to specifically quantify that RF level.
After drawing up my schematic and designing a custom PCB for the unit, I stumbled upon a ready-made product in kit form that used a virtually identical circuit. By the time I factored in PCB manufacturing and shipping costs, it turned out to be cheaper to start with this kit as my working unit, and to simply build a suitable enclosure around it. Ultimately, I settled on using the off-the-shelf kit simply as a matter of economics. However, if anyone would rather build this unit from “scratch”, I can provide the schematic, PCB design, and Gerber files for the PCB, though many will opt for the Proto-Board route on something this simple. The parts list will reflect both build plans - so take your pick!
The design is simple enough that it can be built on a proto-board rather than having a PCB made. It consists of a couple of capacitors, three resistors, two Schottky diodes, an NPN general-purpose transistor, and an LED. Externally, we have a telescoping aerial, a panel meter, a power switch, and a 100K? linear taper potentiometer. Power is supplied by a CR2032 coin cell, which is mounted to the PCB in the kit that I used. My original design called for two “AA” cells in series in a two-cell battery holder. If you build from scratch, the remote battery holder is easier to work with, there is plenty of space in the enclosure for it, and the PCB design has two wire connect points for connection of the battery wires. Of course, with a proto-board the holes are already there - just pick a couple and use them!
The circuit is very basic. The incoming RF produces a DC flow at the diodes. The transistor controls the current through the meter and the LED, which are in series with each other, as well as with a current-limiting series resistance. Because the same current flows through the meter and the LED, the LED intensity will track the meter needle movement. The potentiometer is used to control circuit sensitivity.
The aerial base is attached to the PCB (or proto-board) and its body must be insulated from contact with the enclosure if the enclosure is metallic, as is mine. I chose the two-piece aluminum Hammond 1411-LU, which is readily available from suppliers like Mouser Electronics or Digikey Electronics. The parts list will provide suppliers for all unit parts and components.
I laid out all enclosure drillings on a full-size template, thus ensuring that everything would fit where I wanted to place the individual items - the LED, the meter, and the power switch all on the enclosure cover. On the enclosure front, I laid out a single centered hole location for the sensitivity potentiometer. On the enclosure floor, I laid out a single hole location for mounting the PCB, and then transferred the aerial location to the top cover. This is best done by mounting the bare PCB into place on the enclosure floor, and then measuring the distances from the aerial hole in the PCB to the rear face and to the right-side edge of the enclosure lower half. Use these measurements to locate the aerial hole center on the enclosure upper half. Accuracy should be within 1/16” in each direction.
When I assembled the PCB, I made some changes from the intended configuration to aid in my plan to enclose the PCB. Specifically, I replaced the 2-pin jumper used as the power on control with a 2-pin 0.100” KK-series 0° ramp-lock header. I installed another of those headers at the LED installation location, and I installed a 3-pin version at the potentiometer install location. These headers allowed me to connect the meter and LED to the PCB via one plug, the power switch to the PCB via another plug, and the sensitivity pot via a third plug. All of this was to make it easier to access the PCB for battery change purposes. The ramp-lock plug bodies prevent reversal of the plugs on their headers, but care must be taken to avoid accidental crossing of the LED/meter and power switch leads. Figure 2 shows the assembled PCB prior to installation.
The PCB is grounded to the enclosure via its single mounting point, which is accomplished via a 4-40 x 3/8” machine screw/nut combination and a 1/8” long nylon spacer. The area of the enclosure floor under the PCB was covered with two layers of electrician’s friction tape to prevent inadvertent shorts that might occur from any downward pressure on the aerial, because of the fact that the PCB is mounted by a single screw. Figure 3 shows the prepared lower enclosure half, while in Figure 4 we see the PCB installed into the enclosure bottom half.
The enclosure labeling was accomplished via the use of waterslide decals, a single large one each for the top and bottom surfaces, and a single control legend for the sensitivity control on the front surface. All drilled holes to be made (including a 3/8” diameter hole at the center of the meter location) were drilled before the decals were applied. The large meter cutout hole was made with a nibbler tool after the decal had cured in place. The waterslide decals were produced in CorelDraw!®, and were printed on waterslide decal laser stock in my laser printer, all on a single letter-size sheet. The decals were cut out of the sheet and applied to the enclosure surfaces, and were then allowed to cure overnight for complete drying.
The meter face is customized to reflect a scale of zero to five, with half-unit ticks also being marked. These meter marking units are arbitrary and have no meaning other than to indicate the relative strength of an encountered RF field. Because of the near linearity of the circuit, a field reading 5 on the meter is roughly twice as strong as one reading 2-1/2. The actual values involved are in milliamps, with a reading of 2-1/2 equating to a current of 25mA through both the meter and the LED. The custom meter face was made by first removing the meter crystal and the meter faceplate from the meter. The faceplate was then scanned into CorelDraw!® and used as a drawing template for a new face. I drew a large circle to align with the meter arc, and added diametric lines rotated to the various angles necessary to make the tick marks. All were then weld-trimmed to the desired lengths and the line weights were increased to approximate the original scale appearance. The faceplate test was added, and then the faceplate outline was drawn. After printing on label sheet stock, the new face was self-adhered to the back of the original faceplate, which was then re-installed on the meter. Installation of the crystal completed the job.
The wire leads to the sensitivity control are sequenced in order just as if the control was installed in the PCB. This is important to maintain proper directionality of the control in operation. The power switch is a miniature SPST toggle switch. The leads from the switch are not position-sensitive and may be connected in either orientation. The wiring of the LED and meter is polarity-sensitive. The anode lead of the LED is connected to the LED anode pin position on the PCB. The LED cathode lead is then connected to the meter positive post, with the meter negative post being connected to the LED cathode pin position on the PCB.
The enclosure is comprised of two interlocking squared-off open “U” structures, one of which forms the top and two sides while the other forms the bottom and front and rear panels. Figure 5 shows the inside of the assembled upper half of the enclosure. Note that the hole through which the aerial will pass is insulated with a neoprene grommet. The grommet serves two purposes. Obviously, it insulates the aerial from the cover, but secondly, it provides lateral support for the aerial, which is otherwise secured only by the nut on its lower end. This view also lets us see that the meter and the LED are wired in series, observing the correct polarity of both devices.
In Figure 6 we see the upper half of the enclosure with its electrical leads connected to the PCB. The final assembly involves sliding the upper half down over the lower half, while ensuring that the wire leads stay inside the enclosure and the aerial projects through its grommet.
Figures 7, 8, and 9 are external views of the completed unit. Figure 7 depicts the top cover and meter face. Figure 8 shows the bottom surface and its informative label and rubber feet, and Figure 9 shows the sensitivity control on the front panel.
To use the Relative RF Field Strength Indicator, simply extend the aerial to its full length and flip the power switch to its “ON” position. In the presence of an RF field, the LED will illuminate and the meter needle will deflect to the right. The stronger the RF field, the brighter the LED will be and the more the meter needle will deflect. A weak RF field will require clockwise adjustment of the sensitivity control to light up the LED and activate the meter.
With a little bit of practice, the meter can be used to identify those areas in the shack where RF hot spots exist, and for those hams who are into QRP rigs, it works well for reading output power and delineating radiation patterns. Whatever your use, it is a handy little tool to have around the shack.
